NPS (Net Promoter Score) Calculator
Paste your survey scores or a CSV export and calculate your NPS in seconds. You also see how much the score could swing and which clients are ready to vouch for you.
- Raw scores, counts or a whole CSV
- Margin of error and NPS by service line
- No signup. Nothing leaves your browser
Reading 40 scores from 0 to 10.
Everything runs in your browser. Nothing you paste or upload is sent anywhere or saved.
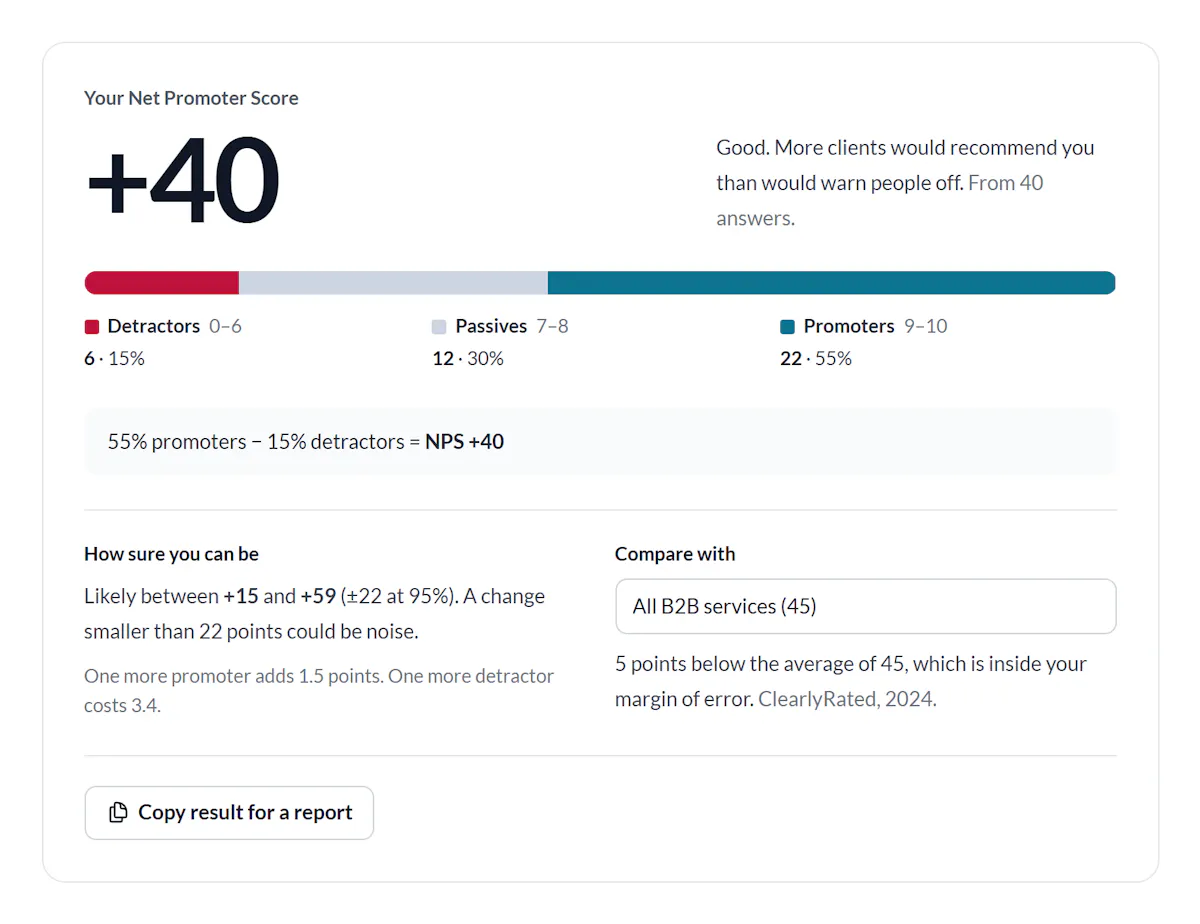
Your Net Promoter Score
+40
Good. More clients would recommend you than would warn people off. From 40 answers.
- Detractors 0–6
- 6 · 15%
- Passives 7–8
- 12 · 30%
- Promoters 9–10
- 22 · 55%
How sure you can be
Likely between +15 and +59 (±22 at 95%). A change smaller than 22 points could be noise.
One more promoter adds 1.5 points. One more detractor costs 3.4.
5 points below the average of 45, which is inside your margin of error. ClearlyRated, 2024.
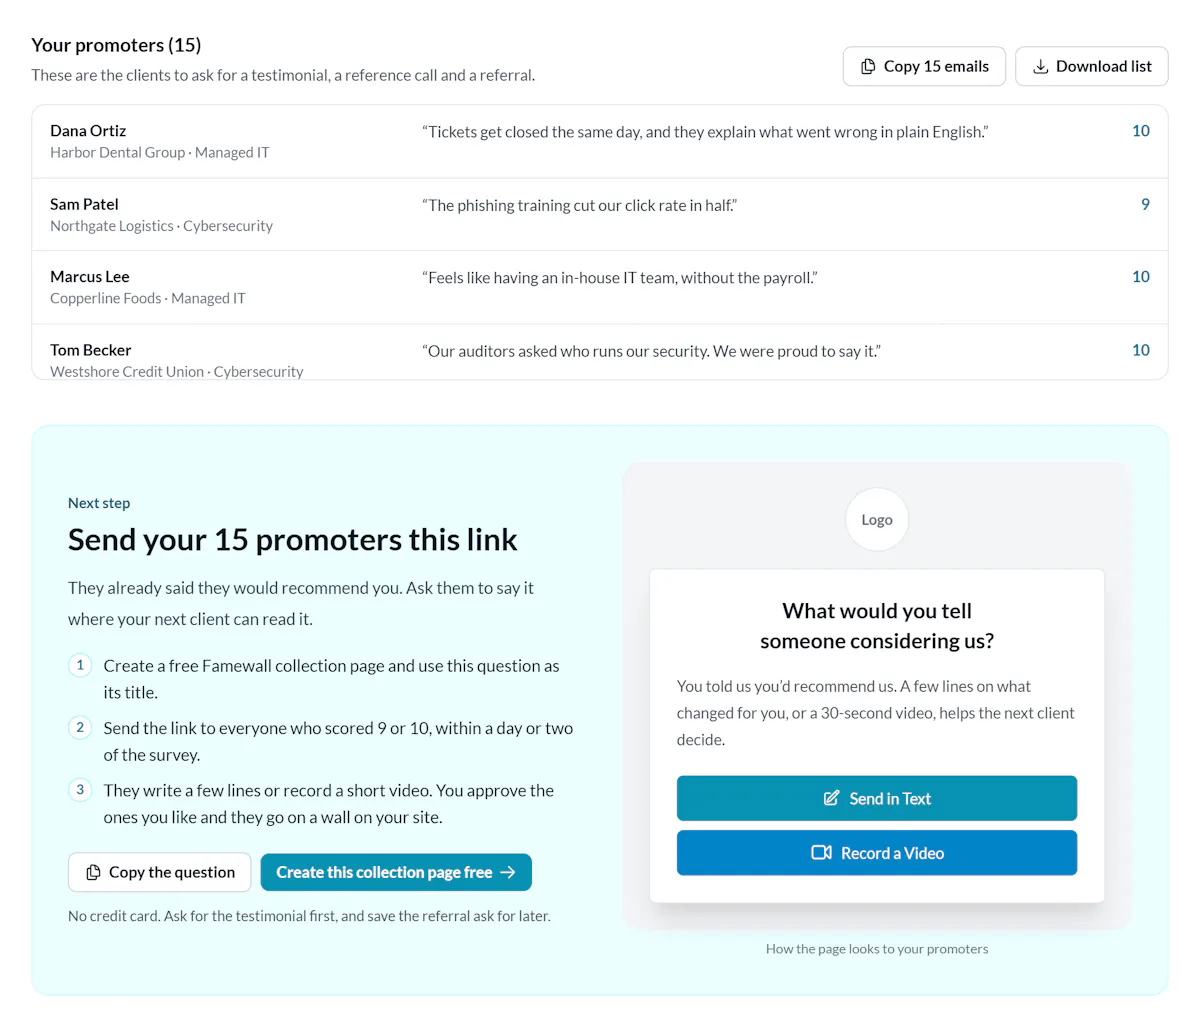
Next step
Send your 22 promoters this link
They already said they would recommend you. Ask them to say it where your next client can read it.
- Create a free Famewall collection page and use this question as its title.
- Send the link to everyone who scored 9 or 10, within a day or two of the survey.
- They write a few lines or record a short video. You approve the ones you like and they go on a wall on your site.
No credit card. Ask for the testimonial first, and save the referral ask for later.
What would you tell someone considering us?
You told us you’d recommend us. A few lines on what changed for you, or a 30-second video, helps the next client decide.
How the page looks to your promoters
How to calculate NPS: % promoters minus % detractors
The Net Promoter Score comes from one question and one subtraction. Bain & Company, who created it, still describes it that way.
The NPS formula
NPS = % promoters − % detractors
Ask one question on a 0 to 10 scale
Ask “How likely are you to recommend us to a friend or colleague?” and let people answer from 0 (not at all likely) to 10 (extremely likely).
Sort the answers into three groups
Scores of 9 and 10 are promoters. 7 and 8 are passives. 0 to 6 are detractors.
Turn each group into a percentage
Divide the number of promoters by the total number of answers and multiply by 100. Do the same for detractors.
Subtract detractors from promoters
NPS = % promoters − % detractors. The result is a whole number from −100 to +100.
The NPS formula for Excel and Google Sheets
Put one score per row in a column with a header in row 1. Type that column’s letter and paste the formula into any empty cell.
=(COUNTIF(B2:B1000,">=9")-COUNTIF(B2:B1000,"<=6"))/COUNT(B2:B1000)*100Use the NPS calculator in 4 steps
Paste, read, split and send. There is nothing to install and no account to make.
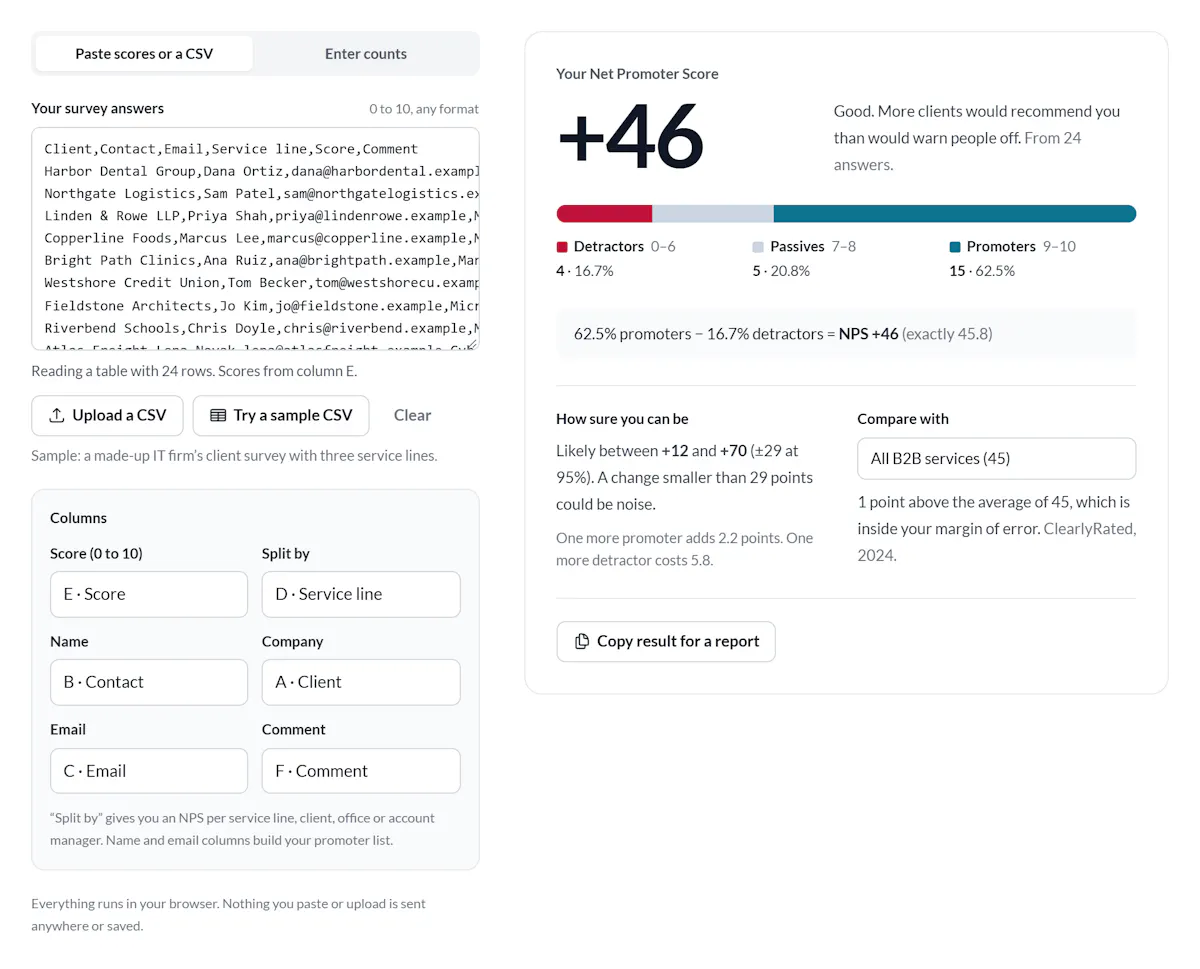
Paste your answers, a CSV or your counts
Copy the score column from your survey tool and paste it in.
Commas, one score per line or a whole CSV with a header row all work.
Read your score and how sure you can be
You get your NPS, the split between promoters, passives and detractors, and a 95% margin of error.
That tells you which changes are real.
Split it by service line or client
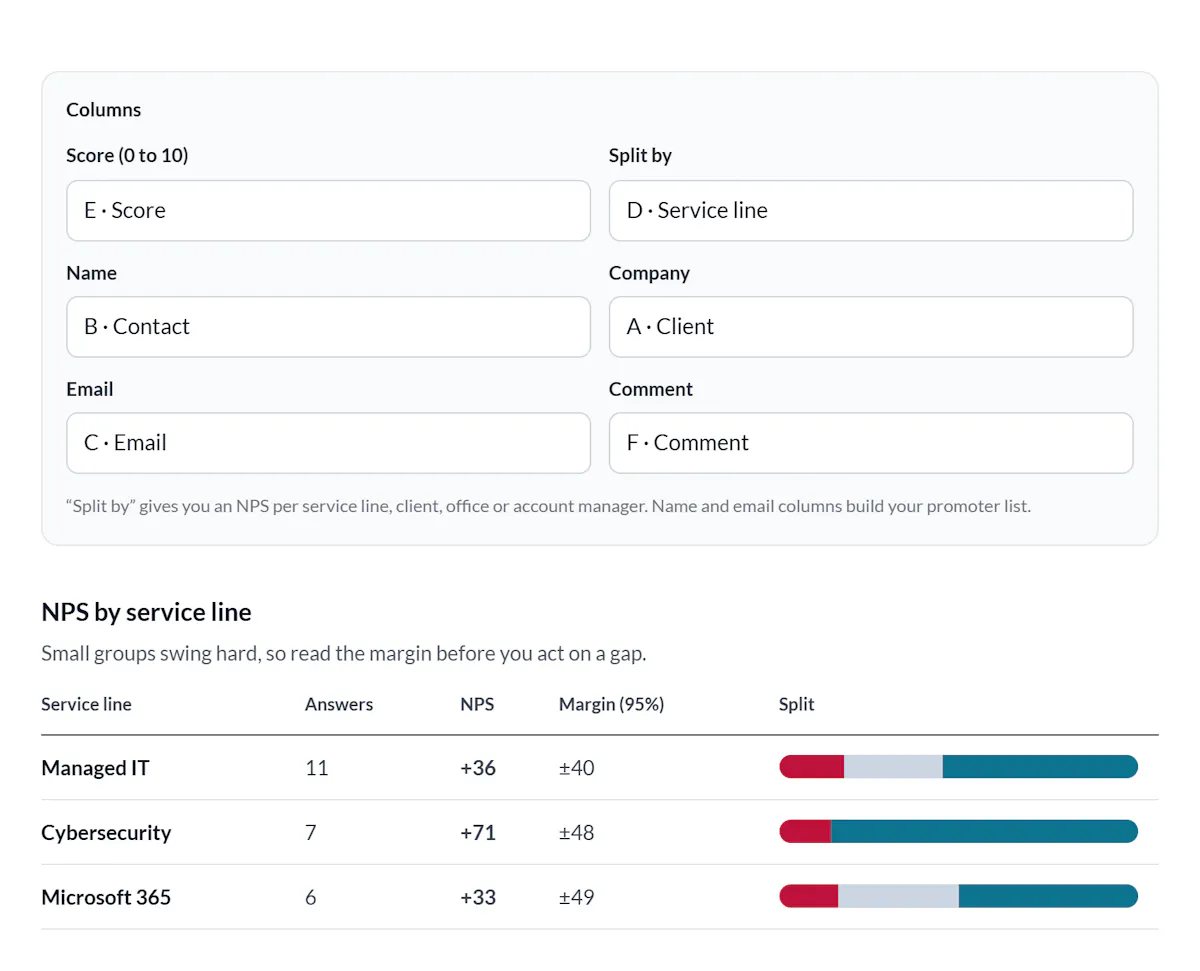
If your CSV has a column for service line, client, office or account manager, pick it under Split by.
Each group gets its own NPS and margin.
Send your promoters one link
Your promoters are listed with their comments. Copy their emails or download the list.
Then send them a collection page that asks one question.
NPS asks about the relationship. CSAT asks about one moment.
Track both, plus retention to see who actually stayed.
| Metric | Formula | Tells you |
|---|---|---|
| NPS | % promoters (9–10) − % detractors (0–6) | How the whole relationship is going |
| CSAT | % of 4s and 5s on a 1 to 5 scale | Whether one project, ticket or meeting landed |
| Net CSAT | % good − % bad | The same, on 3-face MSP ticket surveys like SmileBack |
| Retention rate | (clients at end − new clients) ÷ clients at start | How many clients stayed |
| Churn rate | 100% − retention rate | How many clients left |
NPS survey questions that get answers you can use
Ask the score question the standard way. Then ask one follow-up, and change it by score.
Send it from a named person, not a no-reply address. Keep it to the score plus one question. If you want a longer client feedback form after a project, put the NPS question first and make the rest optional.
The NPS question
How likely are you to recommend [firm] to a friend or colleague?
0 = not at all likely · 10 = extremely likely
The follow-up, by score
Detractors (0 to 6)
What is the one thing we should fix first?
Passives (7 or 8)
What would have made this a 10?
Promoters (9 or 10)
What would you tell someone considering us?
Agencies, asking clients
- How likely are you to recommend our agency to another marketing lead?
- Which part of our work made the biggest difference for you this quarter?
- If you could change one thing about how we report, what would it be?
In-house marketing teams, asking customers
- How likely are you to recommend [product] to a colleague in your field?
- What were you trying to get done when you started using [product]?
- What almost stopped you from buying?
MSPs and IT firms
- How likely are you to recommend us to another business owner?
- Think about your last few tickets. What stood out, good or bad?
- What do you want to see at your next quarterly review?
Recruiting and staffing firms
- How likely are you to recommend us to another hiring manager?
- How well did the people we placed fit your team?
- For candidates: how likely are you to recommend us to a friend who is job hunting?
Accounting, legal and advisory firms
- How likely are you to recommend our firm to a friend or colleague?
- How clearly did we explain what we were doing and why?
- How did this year’s work with us compare with last year’s?
Your promoters are already your testimonial list.
Most firms run NPS, thank the 9s and 10s and stop there. Those clients just told you they would recommend you. Many will say it in public if you ask them the right question.
So ask. Send every promoter a collection page with one question. They write a few lines or record a short video testimonial in the browser. You approve the best ones and they go live on a wall of client results on your own site.
If you run more than one service line, give each its own wall. Jumpstart, a recruiting firm, runs nine walls with separate ones for clients and candidates. They serve about 32,000 views a month. MSPs can do the same with a wall on each service page, and agencies run one wall per client site.
Save the referral for a second ask. The testimonial is the easier yes, and it gives you a reason to thank them when you ask for a referral.
What would you tell someone considering us?
You told us you’d recommend us. A few lines on what changed for you, or a 30-second video, helps the next client decide.
The question to use as your page title.
Frequently asked questions
Looking for software to send NPS surveys on a schedule? Here are six NPS tools we tested.
How do you calculate NPS?
Subtract the percentage of detractors (scores 0 to 6) from the percentage of promoters (9 or 10). Passives (7 or 8) count in the total only. If 55% of answers are promoters and 15% are detractors, your NPS is 40.
Is NPS a percentage?
No. It is built from two percentages, but the result is a number from −100 to +100. Write 40, not 40%.
What is a good NPS for a B2B services firm?
ClearlyRated’s 2024 study put the average B2B services firm at 45. IT services scored 55, staffing 45, accounting 38 and legal 37. A score above 50 is usually called excellent and above 70 world-class.
How many responses do you need for a reliable NPS?
With 40 answers the margin of error is about ±22 points. With 100 it is about ±14. Under 20 answers, read the comments and treat the score as a rough guide.
What is the difference between NPS and CSAT?
NPS asks how likely a client is to recommend you, on a 0 to 10 scale. CSAT asks how satisfied they were with one thing, usually on a 1 to 5 scale, and counts the share of 4s and 5s. Use NPS for the relationship and CSAT for single tickets or projects.
How do you calculate customer retention rate and churn rate?
Retention rate is clients at the end minus new clients won, divided by clients at the start, times 100. Churn rate is 100 minus that. Start with 40 clients, win 6 and end with 42, and you kept 36. That is a 90% retention rate and 10% churn.